|
There is a reason why the establishment changed the name of the hoax from "Global Warming" to "Climate Change"! The Great Global Warming Blunder: How Mother Nature Fooled the World's Top Climate Scientists Global Warming: The Science and the Pseudoscience Climategate: A Veteran Meteorologist Exposes the Global Warming Scam Unstoppable Global Warming: Every 1,500 Years, Updated and Expanded Edition Global Warming False Alarm: The Bad Science Behind the United Nations' Assertion that Man-made CO2 Causes Global Warming Climate Confusion: How Global Warming Hysteria Leads to Bad Science, Pandering Politicians and Misguided Policies That Hurt the Poor
0 Comments
This story has been circulating on the internet but, in this rare case, Snopes did an accurate fact check and debunked the false narrative about NASA.
From Snopes: "On its Earth Observatory web site, NASA published in the year 2000, the information they possessed about the Milankovitch Climate Theory, which was PROVED to be fact by core samples from the earth’s seas. Climate Changes – warming and destructive weather – happen naturally from changes in earth’s solar orbit, and the extent of earth’s axis tilt. NOT from man-induced factors!" This story was picked up by the website Natural News, where it gained further virality. One of the more telling approaches for outlets that promote a specific brand of climate-change denial is to report as news their “discovery” of something that, while perhaps new to them, is fundamental to the field of climate science and in no way in conflict with the concept of anthropogenic climate change. When climate scientists discuss evidence for anthropogenic changes in the climate system, they do not simultaneously argue that there are no natural causes of variation in the climate system. Asserting that would be a straw-man argument. Evidence of natural climate variability is not evidence of a lack of human input into the climate system. That is, however, the sole premise both the Natural News and Hal Turner posts work with, per Natural News" My view is that the facts and science are strong enough to completely debunk the globalist junkscience religion of "man-made" climate change. AGW skeptics proliferating easily debunked fake news is very counterproductive. Sources: - www.naturalnews.com/2019-08-30-nasa-admits-climate-change-not-caused-by-suvs-fossil-fuels.html - www.snopes.com/fact-check/nasa-climate-change-admission Please pay heed to the real science, which is very different from the politicized junkscience of the U.N. Intergovernmental Panel on Climate Change (IPCC) "At around 2040-2050 we will be in a new major Solar Minimum. It is to be expected that we will then have a new “Little Ice Age” over the Arctic and NW Europe. The past Solar Minima were linked to a general speeding-up of the Earth’s rate of rotation. This affected the surface currents and southward penetration of Arctic water in the North Atlantic causing “Little Ice Ages” over northwestern Europe and the Arctic." "During the Spörer, Maunder and Dalton Solar Minima, Arctic water was forced southwards all the way down to Mid-Portugal and the adjacent land areas experienced “Little Ice Ages” (Mörner, 1995, 2010). At the same time, however, the Gibraltar and NW Africa experienced warm events. This North-South opposed climate conditions are well understood in terms of differential distribution of current flow-masses along the northern and southern branches, respectively, of the Gulf Stream (Mörner, 1995, 2010)." "Due to the changes in rotation, the oceanic surface current system is forced to respond (Figure 1). As a function of this, the Gulf Stream alters its main distribution of water along the northern and southern branches, and simultaneously cold Arctic water can, at the speeding-up phases of Solar Minima, penetrate far down along the west coasts of Europe creating Little Ice Age environmental conditions" "The date of the New Solar Minimum has been assigned at around 2040 by Mörner et al. (2003), at 2030-2040 by Harrara (2010), at 2042 ±11 by Abdassamatov (2010) and at 2030-2040 by Scafetta (2010), implying a fairly congruent picture despite somewhat different ways of transferring past signals into future predictions. The onset of the associated cooling has been given at 2010 by Easterbrook (2010) and Herrara (2010), and at “approximately 2014” by Abdassamatov (2010). Easterbrook (2010) backs up his claim that the cooling has already commenced by geological observations facts. At any rate, from a Solar-Terrestrial point of view, we will, by the middle of this century, be in a New Solar Minimum and in a New Little Ice Age. This conclusion is completely opposite to the scenarios presented by IPCC (2001, 2007). With “the Sun in the centre”, no other conclusion can be drawn, however." Before delving into the fact check, let us first fully understand what only 3% of CO2 emissions due to human activity means: 1. Since it has been over 200 years since the Industrial Revolution, it is safe to assume that human activity has been factored into the Earth's carbon cycle. Remember that most of the CO2 emitted into the atmosphere does not stay there, it is absorbed back into the Earth, for example by plants on land and phytoplankton in the oceans 2. 0.0415% (415 parts per million) of Earth's atmosphere is CO2 3. This means that 0.0415% x 0.97, i.e. 0.040255% (402.55 parts per million) of the Earth's atmosphere is CO2 emitted by NATURAL sources 4. And this also means that 0.0415% x 0.03, i.e. only 0.001245% (12.45 parts per million) of the Earth's atmosphere is CO2 emitted by human activity 5. If humans had been wiped out by a large asteroid or a supervolcano in the 18th century, atmospheric CO2 would still have NATURALLY risen by (415-275) x 97%, i.e. by 135.8 parts per million (ppm) - from 275 ppm to 410.8 ppm between the end of the Little Ice Age (around 1850) to 2019. 6. The quasi-religious belief often repeated on mainstream media that the Earth is tranquil and stable by nature, that there is a natural balance in the carbon cycle is a complete myth. CO2 concentrations in the atmosphere have varied widely over the course of Earth's history with no correlation whatsoever to global temperature. For details see this separate fact check. Note: Just for completeness, it should also be noted that human beings are NATURAL as well. We are not some alien infestation on Planet Earth Now let us prove that only 3% of CO2 emissions into the atmosphere are due to human activity: I. Professor David Karoly who participated in the preparation of the 4th Assessment Report of the IPCC (Intergovernmental Panel on Climate Change) CONFIRMED that only 3% of CO2 emissions into the atmosphere are due to human activity in an interview with Australian Radio Commentator Alan Jones on May 25th, 2011 Biography: Professor David Karoly completed his Bachelor of Science (Hons) degree in Applied Mathematics in 1976 from Monash University and was awarded his PhD in Meteorology from the University of Reading in England in 1980. From 1995 to 2000 he was the Director of the Cooperative Research Centre for Southern Hemisphere Meteorology at Monash University and during 2001-2002 he was Professor of Meteorology and Head of the School of Mathematical Sciences at Monash University. From 2003-2007 he was the Williams Chair Professor of Meteorology at the University of Oklahoma. He returned to Australia in 2007 as an ARC Federation Fellow and Professor of Meteorology at the University of Melbourne – which finished in May 2012. His current position is Professor of Atmospheric Science at Melbourne University’s School of Earth Sciences. Professor Karoly’s research focuses on climate variability and climate change, including greenhouse climate change, stratospheric ozone depletion and interannual climate variations due to El Niño-Southern Oscillation. He is recognised as one of the leading global experts on the dynamics of large-scale atmospheric circulation in the Southern Hemisphere and its variability. He is also recognised as a world leader in the detection and attribution of climate change, particularly at regional scales. Recently, he has been studying the impacts of climate change on weather extremes and their impacts on human and natural systems. Professor Karoly is a member of the Climate Change Authority, established in 2012 as an independent body that provides expert advice on the operation of Australia’s carbon price, emissions reduction targets and other Australian Government climate change mitigation initiatives. In 2013, he became a member of the Scientific Steering Committee for the World Meteorological Organization (WMO)/United Nations Environment Programme Scientific Assessment of Ozone Depletion 2014. During 2011-2012, he was a member of the Joint Scientific Committee that provides scientific oversight to the World Climate Research Programme. From 2008-2009 he was Chair of the Premier of Victoria's Climate Change Reference Group. He is also a member of the Wentworth Group of Concerned Scientists. Professor Karoly was involved, through several different roles, in the preparation of the Intergovernmental Panel on Climate Change (IPCC) 4th Assessment Report and was a Review Editor for a chapter in the IPCC 5th Assessment Report. Recent awards received include the 2014 Morton Medal of the Australian Meteorological and Oceanographic Society for “leadership in meteorology, oceanography, climate and related fields, particularly through education and the development of young scientists” and the 2015 Royal Society of Victoria Medal for Scientific Excellence for “excellence and leadership in scientific research in the Earth Sciences”. Naturally Professor David Karoly no longer remembers what he said on the radio, but below is audio of his May 25th, 2011 radio interview with CATEGORICALLY CONFIRMS that he said only 3% of CO2 emissions are due to human activity: Start at position 2:57 of below video II. Jonathan DuHamel (WryHeat) and Anthony Watts on July 29th, 2014: "EPA document supports ~3% of atmospheric carbon dioxide is attributable to human sources" "A new post on The Hockey Schtick reviews a new paper “that finds only about 3.75% [15 ppm] of the CO2 in the lower atmosphere is man-made from the burning of fossil fuels, and thus, the vast remainder of the 400 ppm atmospheric CO2 is from land-use changes and natural sources such as ocean outgassing and plant respiration.” This new work supports an old table from the Energy Information Administration which shows the same thing: only about 3% of atmospheric carbon dioxide is attributable to human sources. The numbers are from IPCC data. Look at the table and do the arithmetic: 23,100/793,100 = 0.029. URL for table: http://www.eia.doe.gov/oiaf/1605/archive/gg04rpt/pdf/tbl3.pdf" Since 2014 the EPA document referenced above has mysteriously disappeared (naturally!), but screenshots are forever: 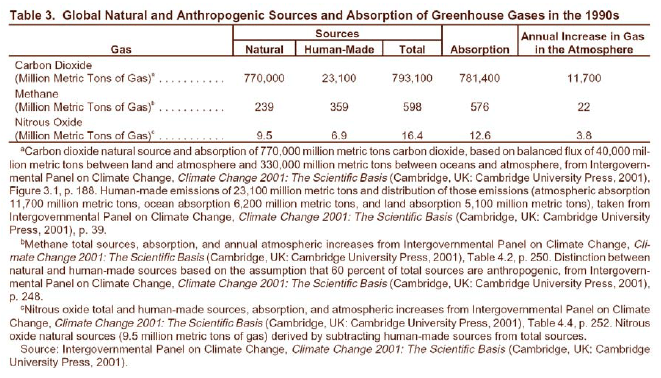 III. An article from Skepticalscience.com, a globalist climate change propaganda outlet, keeps spreading the myth that everything in Earth's natural carbon cycle has always been in perfect equilibrium and bad humans disrupted this stability (when a study of Paleo CO2 concentrations over the past 500 million years and absolute lack of correlation with global temperatures completely debunks this myth). But the article also contains data on human vs. natural CO2 emissions! "Manmade CO2 emissions are much smaller than natural emissions. Consumption of vegetation by animals & microbes accounts for about 220 gigatonnes of CO2 per year. Respiration by vegetation emits around 220 gigatonnes. The ocean releases about 332 gigatonnes. In contrast, when you combine the effect of fossil fuel burning and changes in land use, human CO2 emissions are only around 29 gigatonnes per year." Let us do the math with the above data! Guess what? Human CO2 emissions are calculated at 3.6% of total emissions! Natural CO2 emissions:
Human CO2 emissions: 29 gigatons (3.6%) TOTAL CO2 emissions (natural+human): 801 gigatons Amazingly the Skepticalscience.com article makes no mention of unpredictable volcanic eruptions which spew all kinds of gases into the atmosphere including water vapor (H2O), carbon dioxide (CO2), sulfur either as sulfur dioxide (SO2) (high-temperature volcanic gases) or hydrogen sulfide (H2S) (low-temperature volcanic gases), nitrogen, argon, helium, neon, methane, carbon monoxide and hydrogen. Volcanoes have been a major factor in natural climate change during earth's history, including during the period of human existence on the planet. Examples include:
One would guess that volcanoes would have disrupted the fairy tale in the rest of the Skepticalscience.com article about how beautiful, gentle Earth has always been in perfect balance until evil, unnatural human beings came along! Sources:
- youtu.be/ViY2J3LPgN4 - www.climatescience.org.au/staff/profile/dkaroly - wryheat.wordpress.com/2014/07/19/only-about-3-of-co2-in-atmosphere-due-to-burning-fossil-fuels - wattsupwiththat.com/2014/07/29/epa-document-supports-3-of-atmospheric-carbon-dioxide-is-attributable-to-human-sources - hockeyschtick.blogspot.com/2014/07/new-paper-finds-only-375-of-atmospheric.html - skepticalscience.com/human-co2-smaller-than-natural-emissions.htm - en.wikipedia.org/wiki/Volcanic_gas - en.wikipedia.org/wiki/1883_eruption_of_Krakatoa - en.wikipedia.org/wiki/Toba_catastrophe_theory - en.wikipedia.org/wiki/List_of_large_volcanic_eruptions Dr. Judith Curry is Professor and former Chair of the School of Earth and Atmospheric Sciences at the Georgia Institute of Technology. Dr. Curry received a Ph.D. in atmospheric science from the University of Chicago in 1982. Prior to joining the faculty at Georgia Tech, she held faculty positions at the University of Colorado, Penn State University and Purdue University. With research interests spanning a variety of topics in climate, her current interests include climate dynamics of the Arctic, climate dynamics of extreme weather events, and reasoning about climate uncertainty. She is a Fellow of the American Meteorological Society, the American Association for the Advancement of Science, and the American Geophysical Union. Dr. Judith Curry on Bullying of Global Warming Skeptics: Judith Curry's verbal remarks as delivered in 2015 to the US Senate Commerce Committee Hearing on "Data or Dogma? Promoting Open Inquiry in the Debate Over the Magnitude of the Human Impact on Earth’s Climate." Scientist Judith Curry and Author Mark Steyn question, school Sen Markey on climate: Hearing: Data or Dogma? Promoting Open Inquiry in the Debate over the Magnitude of Human Impact on Earth's Climate. US Senate Committee on Commerce, Science, and Transportation December 8, 2015 Judith Curry schools Congressman Beyer on climate change: Georgia Tech Earth and Atmospheric Sciences Professor Judith Curry schools Congressman Don Beyer on climate change. Professor Curry: 'The climate has been warming since the 1700's, okay, since we came out of the 'Little Ice Age'.' House Committee on Science, Space, and Technology April 15, 2015 Judith Curry in House Natural Resources Committee Hearing on Climate Change 2019 02 09: Comment from YouTube account GEORGELET4: "A Voice of Reason. However those who lead the alarmists' hysteria, many for financial and political motives of their own, will call her a "denier". Judith Curry on Tucker Carlson's show explaining how climate science has been thoroughly corrupted and politicized: Judith Curry - Climate Science and the Uncertainty Monster: How to understand and reason about uncertainty in climate science is a topic that is receiving increasing attention in both the scientific and philosophical literature. This is one perspective on exploring ways to understand, assess and reason about uncertainty in climate science. Uncertainty associated with climate science and the science-policy interface presents unique challenges adding to the complexity of the climate system itself, the potential for adverse socioeconomic impacts of climate change, and politicization of proposed policies to reduce societal vulnerability to climate change. The challenges to handling uncertainty at the science-policy interface are framed using the ‘monster’ metaphor, whereby attempts to tame the monster are described. Uncertainty of climate models is interpreted in the context of model inadequacy, uncertainty in model parameter values, and initial condition uncertainty. The challenges of building confidence in climate models are described. A concerted effort is needed to identify better ways of framing the climate change problem, explore and characterize uncertainty, reason about uncertainty in the context of evidence-based logical hierarchies, and eliminate bias from the consensus building process. Dr. Curry has recently presented U.S. Congressional Testimony to the Senate Committee on Environment and Public Works and the House Subcommittee on the Environment. Dr. Curry is a prominent public spokesperson on issues associated with the integrity of climate research. Curry serves as president and co-owner of the company Climate Forecast Applications Network LLC (CFAN). CFAN translates the scientific weather and climate research so that governments and industries can better anticipate and manage weather- and climate-related risks. She is proprietor of the blog Climate Etc., which discusses current topics in climate science, climate and energy policy, challenges at the science-policy interface, and use of social media in engaging with the public on complex and controversial topics.
Sources: - www.youtube.com/watch?v=AAcThUptRA4 - www.youtube.com/watch?v=Oh6zDbWMuP0 - www.youtube.com/watch?v=evz28YKCPCo - www.youtube.com/watch?v=5RIepllnjFA - www.youtube.com/watch?v=z4ys2HCq-pw - www.youtube.com/watch?v=D4AAN0H8MRg The woolly mammoth (M. primigenius) was the last species of the genus. Most populations of the woolly mammoth in North America and Eurasia, as well as all the Columbian mammoths (M. columbi) in North America, died out around the time of the last glacial retreat, as part of a mass extinction of megafauna in northern Eurasia and the Americas. Until recently, the last woolly mammoths were generally assumed to have vanished from Europe and southern Siberia about 12,000 years ago, but new findings show some were still present there about 10,000 years ago. Slightly later, the woolly mammoths also disappeared from continental northern Siberia. A small population survived on St. Paul Island, Alaska, up until 3750 BC, and the small mammoths of Wrangel Island survived until 1650 BC. Recent research of sediments in Alaska indicates mammoths survived on the American mainland until 10,000 years ago.
A definitive explanation for their extinction has yet to be agreed upon. The warming trend (Holocene) that occurred 12,000 years ago, accompanied by a glacial retreat and rising sea levels, has been suggested as a contributing factor. Forests replaced open woodlands and grasslands across the continent. The available habitat would have been reduced for some megafaunal species, such as the mammoth. However, such climate changes were nothing new; numerous very similar warming episodes had occurred previously within the ice age of the last several million years without producing comparable megafaunal extinctions, so climate alone is unlikely to have played a decisive role. The spread of advanced human hunters through northern Eurasia and the Americas around the time of the extinctions, however, was a new development, and thus might have contributed significantly. Source: en.wikipedia.org/wiki/Mammoth The 97% is another Big Lie of the Media and their masters. In addition to the true believers, the 97% also includes:
Probably the most widely cited study claiming to find such consensus is John Cook et al.’s “Quantifying the Consensus on Anthropogenic Global Warming in the Scientific Literature”: This study purported to find that “Among abstracts expressing a position on AGW, 97.1% endorsed the consensus position that humans are causing global warming.” Of course, “Humans are causing global warming” is something that nearly every skeptic, including myself, could affirm. The question is not whether we’re causing global warming, but whether we’re causing most of the recent warming, whether it’s dangerous, and whether we should abandon abundant, affordable, reliable energy from fossil fuels in exchange for sparse, expensive, intermittent energy from “renewables” in an effort to stop it. Cook et al. surveyed 11,944 papers on global warming that had been published from 1991 through 2012. They did not read the papers or talk to the authors, but they did read the abstracts. The results of the abstracts were divided into 7 categories. Here is what they found: 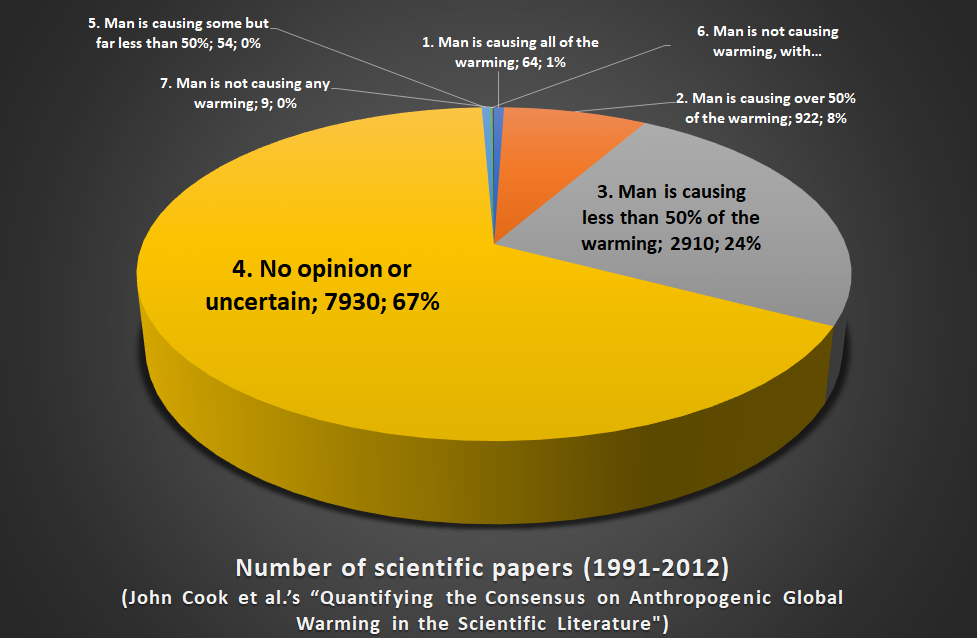 It appears that Cook et al. decided to compare only those scientists who had strong opinions. If that is the case, the first 2 categories represent scientists who believe man is causing all or most of the warming (986), while those in categories 6 and 7 believe man is causing none or almost none (24). This ratio is about 97%. But the most important result of this study is that almost 8,000 had no opinion or were uncertain. So much for the 97%. We have here a clear demonstration of how biased "experts" corrupt raw data during analysis to concoct false "evidence" for the required Big Lie and then tout this Big Lie as incontrovertible "fact":
Also from Forbes:
"The 97% number was popularized by two articles, the first by Naomi Oreskes, now Professor of Science History and Affiliated Professor of Earth and Planetary Sciences at Harvard University, and the second by a group of authors led by John Cook, the Climate Communication Fellow for the Global Change Institute at The University of Queensland. Both papers were based on analyses of earlier publications. Other analyses and surveys arrive at different, often lower, numbers depending in part on how support for the concept was defined and on the population surveyed. In a 2007 book chapter, Oreskes infers that the lack of expressed dissent “demonstrates that any remaining professional dissent is now exceedingly minor.”
In the article, Oreskes said some authors she counted "might believe that current climate change is natural." It is impossible to tell from this analysis how many actually believed it. On that basis, I find that this study does not support the 97% number." Sources: - www.forbes.com/sites/uhenergy/2016/12/14/fact-checking-the-97-consensus-on-anthropogenic-climate-change/#7fa9d7541157 - www.lpl.arizona.edu/sites/default/files/resources/globalwarming/oreskes-chapter-4.pdf - iopscience.iop.org/article/10.1088/1748-9326/8/2/024024 Settled Science according to climate "scientists" and their globalist establishment political masters are:
You may have seen the below graph on Wikipedia. The graph is INACCURATE. Even if the graph shows China's CO2 emissions drastically increasing in the 1990s and 2000s, it portrays China's CO2 emissions as flatlining in the 2010s. This is FALSE! 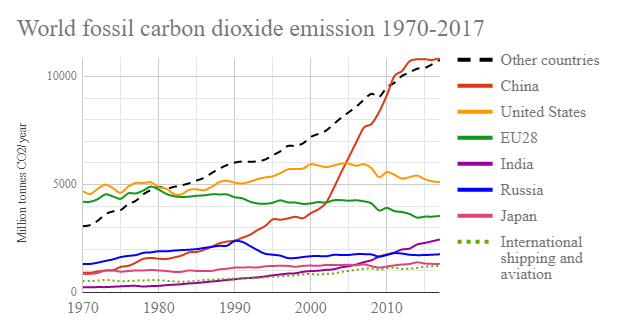 In 2017, China's CO2 emissions INCREASED by 120 MILLION TONS compared to 2016 CO2 emissions! Under the Paris Agreement, China can increase CO2 emissions as much as it wants until a promised peak in 2030. In 2017, India's CO2 emissions INCREASED by OVER 90 MILLION TONS compared to 2016 CO2 emissions! Under the Paris Agreement, India will keep INCREASING CO2 emissions but at a RATE OF INCREASE REDUCED BY 33-35% (compared to 2005 levels) and even that commitment is only a promise to be met by 2030 (not today). 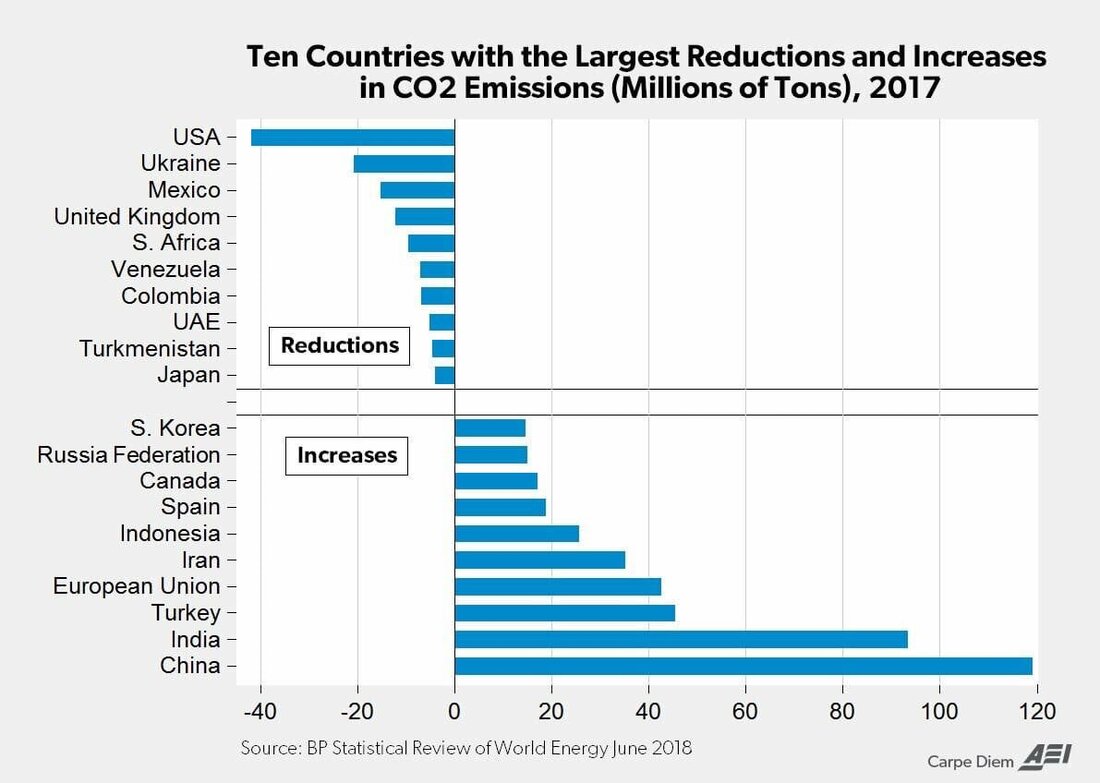 Leftist propagandists, with the help of their fake "fact" checkers, may be quick to dismiss the above graph because it was published by British Petroleum (BP). But the above data has been CONFIRMED by the Global Carbon Project! Global Carbon Project reported even higher 2017 China CO2 emissions increase than BP! 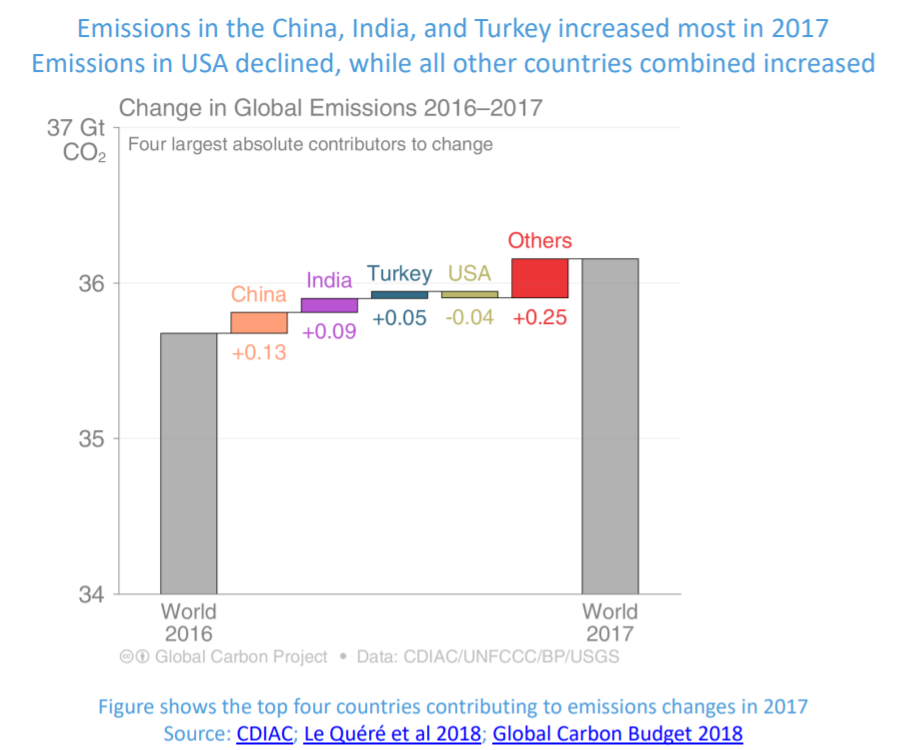 What more proof does one need to be convinced that man-made "climate change" hysteria has nothing to do with the climate and everything to do with globalist wealth redistribution? Below are additional graphs showing the evolution of CO2 emissions by country. 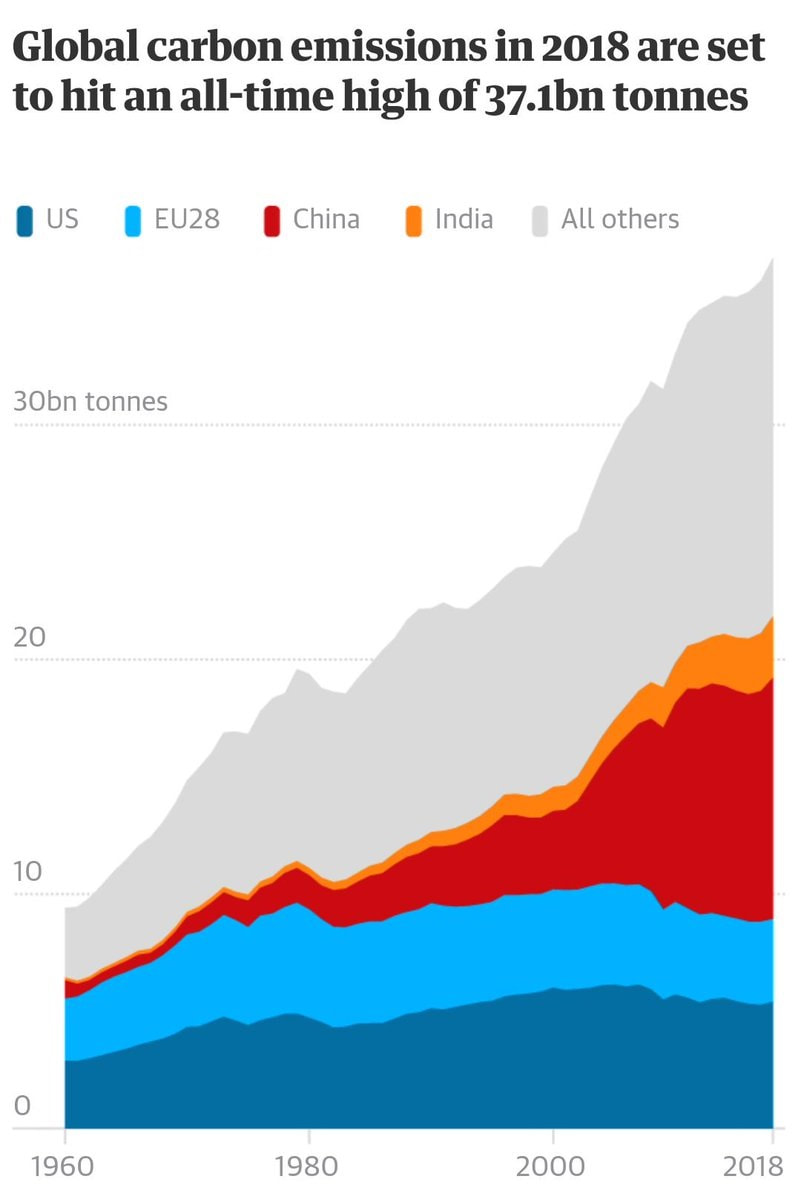 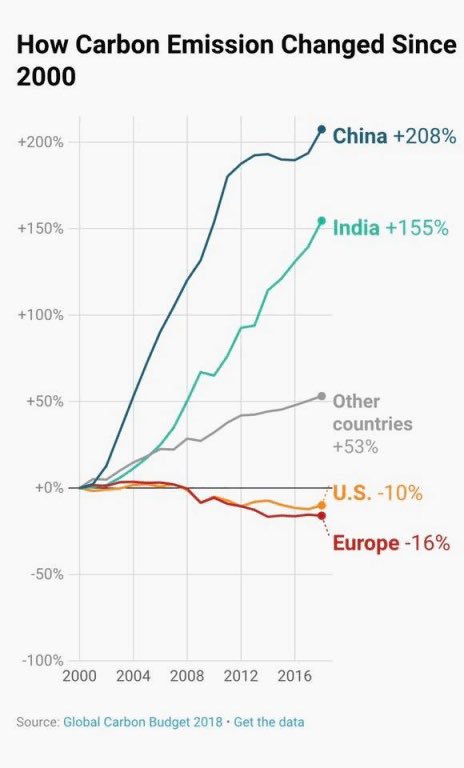 Sources:
2017 CO2 Emissions:
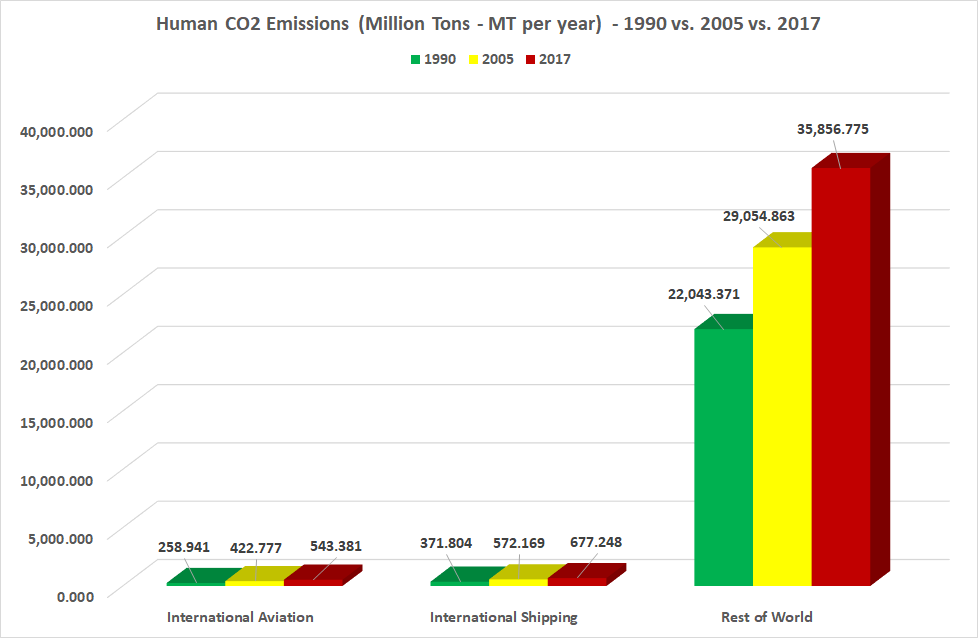
 Evolution of CO2 emissions comparing 1990, 2005 and 2017:
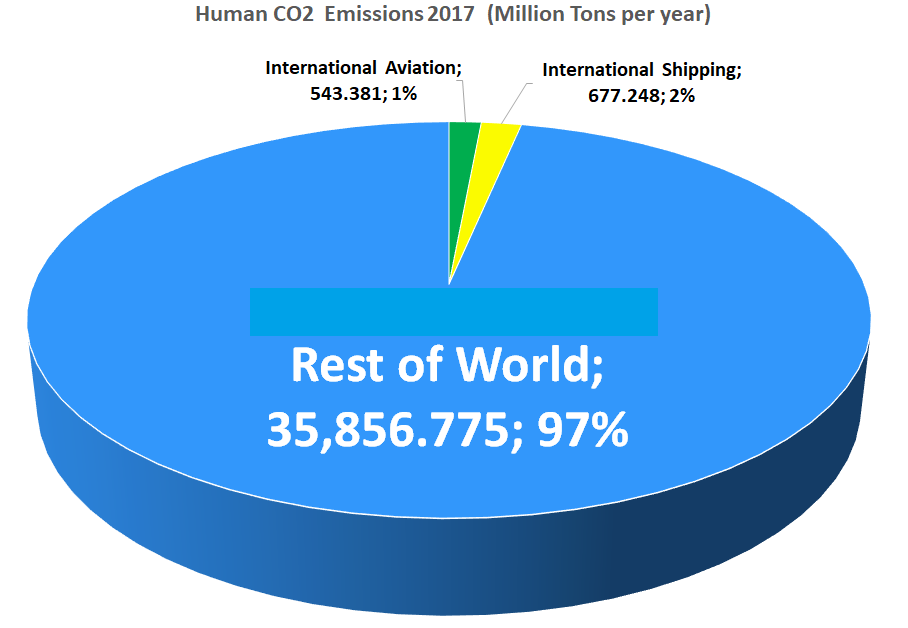
 Why are climate change activists razor-focused on disrupting air travel? Why aren't climate change activists protesting in Beijing and New Delhi, the two countries most responsible for rapid increases in CO2 emissions, past and future? The planet does not care about CO2 per-capita, unless of course the "climate crisis" is a wealth redistribution participation trophy! We are living in the post-fact world where narratives, not real science and cold hard facts, drive global hysteria. The globalist establishment is the Modern Medieval Catholic Church which has successfully pushed and brainwashed billions of people with the religion of climate! By Helen Briggs
BBC News May 31st, 2017 "The agreement requires rich nations to maintain a $100bn a year funding pledge beyond 2020, and to use that figure as a "floor" for further support agreed by 2025. The deal says wealthy countries should continue to provide financial support for poor nations to cope with climate change and encourages other countries to join in on a voluntary basis. Dr Ilan Kelman of UCL, London, says the lack of time scales is "worrying". "The starting point of $100bn per year is helpful, but remains under 8% of worldwide declared military spending each year." Source: www.bbc.com/news/science-environment-35073297 The USA and European Union now only account for 24% of the world's CO2 emissions. And CO2 emissions continue to shrink in these countries due to strong environmental regulations. On the other hand, CO2 emissions in many of the countries responsible for the vast bulk (76%) of CO2 emissions are rapidly increasing, often even accelerating. 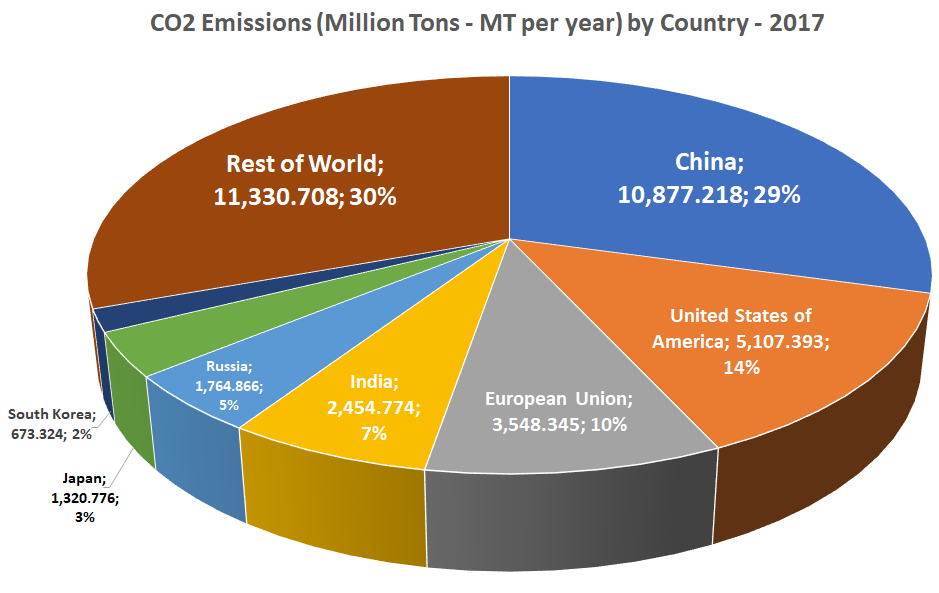 Evolution of CO2 emissions by country comparing 1990, 2005 and 2017: 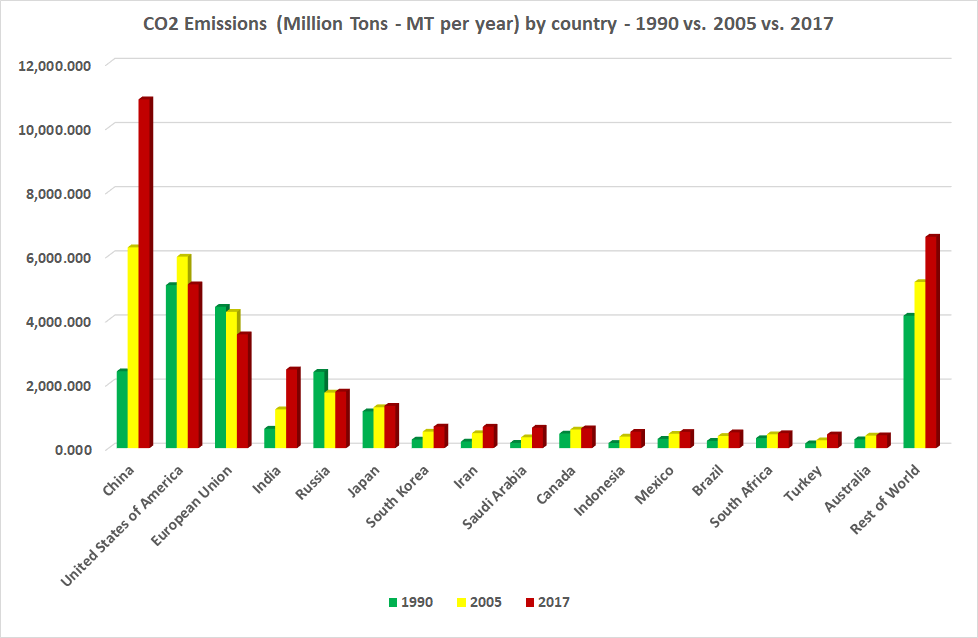 The emissions "targets" of the Paris Agreement for each nation are shrouded in complexity and secrecy. First I went to FactCheck.org's article Trump on the Paris Agreement. As usual, the article is a whitewash of the globalist narrative but it refers to the following UN sources: Annex I countries and Non Annex I countries. So I clicked on these documents to try to discover the elusive emissions "targets". ACCESS DENIED. I wonder how FactCheck.org obtained access to their cited sources.... I finally found the emissions "targets" by country from this web page: www.carbonbrief.org. Amazingly nations don't have targets for the Paris Agreement, they made pledges. And the pledges don't follow any standard format. So many countries used colorful language to hide increases. Examples:
Transparency does not seem to be a priority for the "international community". It is complicated to translate these vague pledges into concrete, easy to understand targets but below are rough estimations for some of the major nations and the EU: 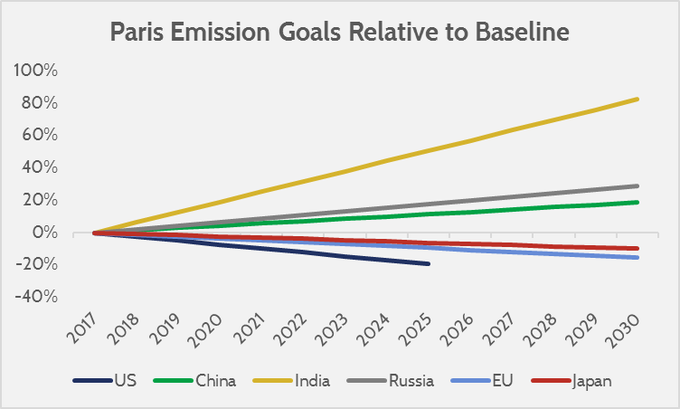 In short, relative to the 2017 baseline:
Based on the Paris Agreement, let us do some simple math to make a rough calculation of the total global CO2 emissions in 2030 compared to 2017 (year after signature of the agreement):
Based on this rough calculation:
The usual response from proponents of the Paris Agreement is that the CO2 emissions PER CAPITA are what is important and what will reduce globally by draconian cuts in CO2 emissions in the Western world. But the planet does not care about per capita! Greenhouse effect of CO2 is not reduced just because each of the 7.5+ billion people is responsible for less CO2 emissions on average. If there is really a climate emergency (the dominant narrative of the media and politicians globally), how will a GLOBAL INCREASE of 6.4% in annual CO2 emissions by 2030 help stop this emergency? This is more concrete factual evidence that climate alarmism is really a globalist WEALTH REDISTRIBUTION scheme. In addition, the BBC reported that "the Paris agreement requires rich nations to maintain a $100 BILLION a year funding pledge beyond 2020, and to use that figure as a "floor" for further support agreed by 2025." The hidden objective is socialism on a global scale: make the people of Western nations poorer and the people of the rest of the world richer. I am not going to debate the morality or economic consequences of global socialism in this article. But what is very upsetting is that elected politicians of Western nations (with the exception of President Donald Trump) refuse to be honest with the populations of those nations that their children and grandchildren will be far less prosperous if this Paris Agreement wealth redistribution scheme is implemented. THAT is highly immoral and undemocratic! Sources:
And atmospheric CO2 concentration during Roman times was at pre-industrial 275 parts per million (ppm) as compared to 415 ppm today (2019).
Daily Caller News Foundation MICHAEL BASTASCH ENERGY EDITOR December 13, 2013 "A Swedish study found that the planet was warmer in ancient Roman times and the Middle Ages than today, challenging the mainstream idea that man-made greenhouse gas emissions are the main drivers of global warming. The study, by scientist Leif Kullman, analyzed 455 “radiocarbon-dated mega-fossils” in the Scandes mountains and found that tree lines for different species of trees were higher during the Roman and Medieval times than they are today. Not only that, but the temperatures were higher as well. “Historical tree line positions are viewed in relation to early 21st century equivalents, and indicate that tree line elevations attained during the past century and in association with modern climate warming are highly unusual, but not unique, phenomena from the perspective of the past 4,800 years,” Kullman found. “Prior to that, the pine tree line (and summer temperatures) was consistently higher than present, as it was also during the Roman and Medieval periods.” Kullman also wrote that “summer temperatures during the early Holocene thermal optimum may have been 2.3°C higher than present.” The “Holocene thermal optimum was a warm period that occurred between 9,000 and 5,000 years ago. This warm period was followed by a gradual cooling period.” According to Kullman, the temperature spikes were during the Roman and Medieval warming periods “were succeeded by a distinct tree line/temperature dip, broadly corresponding to the Little Ice Age.” For many years now, there was an alleged scientific consensus that the Earth was warming due to humans releasing greenhouse gases into the air — primarily through burning fossil fuels. However, temperatures stopped rising after 1998, leaving scientists scrambling to find an explanation to the hiatus in warming. Increasingly, scientists are looking away from human causes and looking at solar activity and natural climate variability for explanations of why the planet warms and cools. “All other things being equal, adding more greenhouse gases to the atmosphere will have a warming effect on the planet,” Judith Curry, a climatologist at the Georgia Institute of Technology, told the Los Angeles Times. “However, all things are never equal, and what we are seeing is natural climate variability dominating over human impact.” The Kullman study points to mounting evidence that climate is largely out of human control, as humans were not burning large amounts fossil fuels during Roman and Medieval times." Some scientists have pointed to solar activity as the predictor of where global temperatures are headed. Researchers have pointed to falling sunspot activity as evidence that the planet will cool off in the coming decades. “By looking back at certain isotopes in ice cores, [Professor Mike Lockwood of Reading University] has been able to determine how active the sun has been over thousands of years,” the BBC reports. “Following analysis of the data, Professor Lockwood believes solar activity is now falling more rapidly than at any time in the last 10,000 years.” Others have looked to natural climate systems for explanations for answers to the 15-year pause in global warming. A study by Dr. Roy Spencer from the University of Alabama, Huntsville found that about half the warming that occurred since the 1970s can be attributed to El Niño weather events, which had a warming effect on the planet. The Pacific Ocean’s natural warming and cooling cycles last about 30 years, with La Niña cooling being dominant from the 1950s to the 1970s and El Niño warming events dominating late 1970s to the late 1990s. Spencer suggests that the world may be in a La Niña cooling period. Follow Michael on Twitter (twitter.com/MikeBastasch) and Facebook (www.facebook.com/MichaelBastaschDCNF) Sources: - dailycaller.com/2013/12/13/study-earth-was-warmer-in-roman-medieval-times - www.co2science.org/articles/V16/N50/EDIT.php - onlinelibrary.wiley.com/doi/abs/10.1111/bor.12003 - dailycaller.com/2013/11/13/multiple-lines-of-evidence-suggest-global-cooling 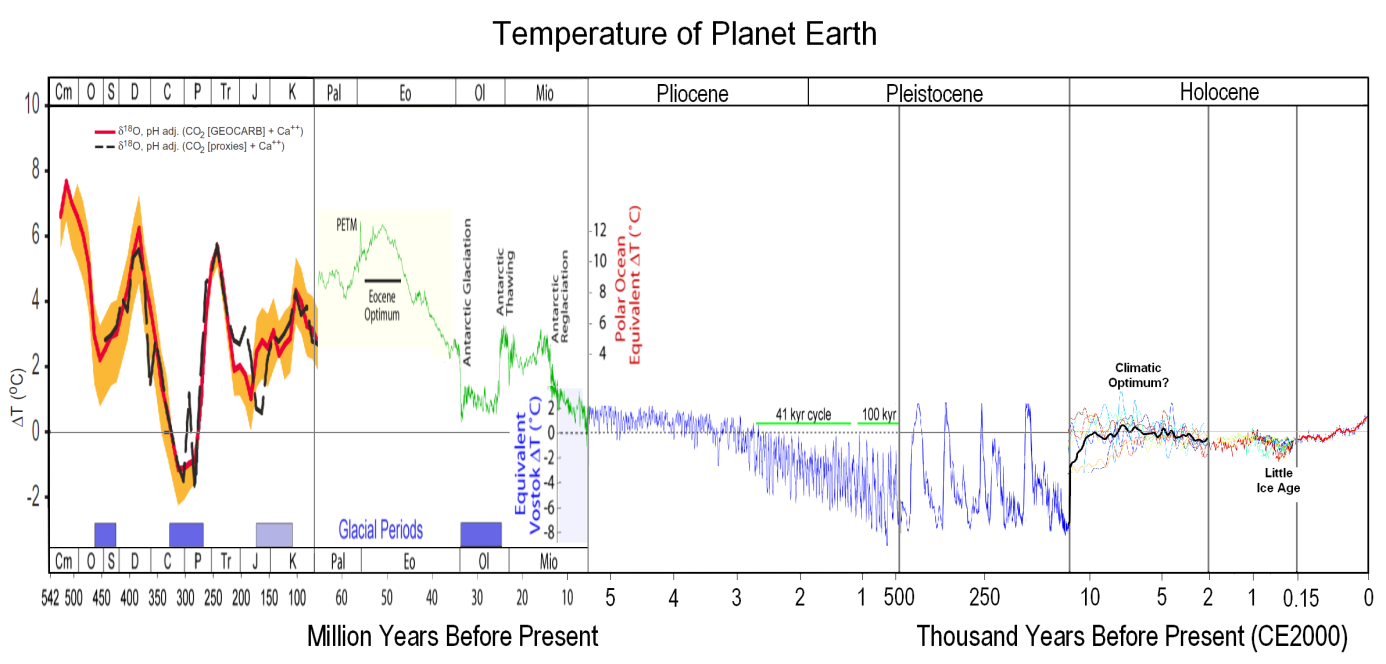 Epoch: Ordovician
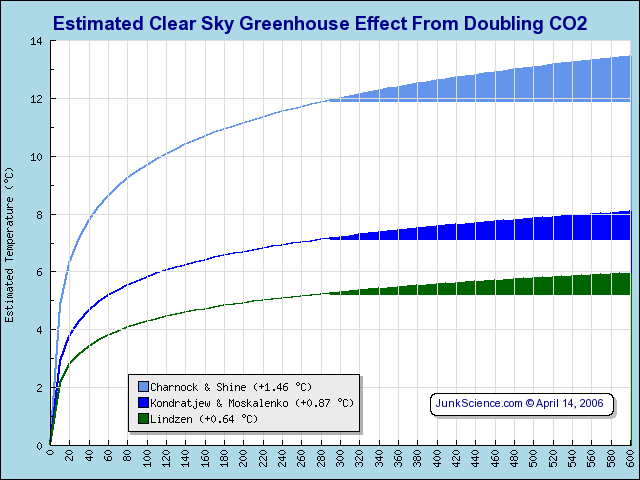
Mean CO2 Concentration: 4200 parts per million (10.5 times that of today) Mean Surface Temperature: 16 °C (2 degrees above current) How long ago?: 480 to 420 million years ago Climate: The Ordovician saw the highest sea levels of the Paleozoic, and the low relief of the continents led to many shelf deposits being formed under hundreds of meters of water. Sea level rose more or less continuously throughout the Early Ordovician, leveling off somewhat during the middle of the period. Locally, some regressions occurred, but sea level rise continued in the beginning of the Late Ordovician. A change was soon on the cards, however, and sea levels fell steadily in accord with the cooling temperatures for the ~30 million years leading up to the Hirnantian glaciation. Within this icy stage, sea level seems to have risen and dropped somewhat, but despite much study the details remain unresolved. At the beginning of the period, around 480 million years ago, the climate was very hot due to high levels of CO2, which gave a strong greenhouse effect. The marine waters are assumed to have been around 45°C, which restricted the diversification of complex multi-cellular organisms. But over time, the climate become cooler, and around 460 million years ago, the ocean temperatures became comparable to those of present day equatorial waters. As with North America and Europe, Gondwana was largely covered with shallow seas during the Ordovician. Shallow clear waters over continental shelves encouraged the growth of organisms that deposit calcium carbonates in their shells and hard parts. The Panthalassic Ocean covered much of the northern hemisphere, and other minor oceans included Proto-Tethys, Paleo-Tethys, Khanty Ocean, which was closed off by the Late Ordovician, Iapetus Ocean, and the new Rheic Ocean. As the Ordovician progressed, we see evidence of glaciers on the land we now know as Africa and South America. At the time these land masses were sitting at the South Pole, and covered by ice caps. Comments: The climate cooled into an Ice Age despite CO2 concentration averaging 4,200 parts per million for the entire period. Epoch: Carboniferous Mean CO2 Concentration: 800 parts per million (twice that of today) Mean Surface Temperature: 14 °C (same as modern global temperature) How long ago?: 360 to 330 million years ago Climate: The early part of the Carboniferous was mostly warm; in the later part of the Carboniferous, the climate cooled. Glaciations in Gondwana, triggered by Gondwana's southward movement, continued into the Permian and because of the lack of clear markers and breaks, the deposits of this glacial period are often referred to as Permo-Carboniferous in age. The cooling and drying of the climate led to the Carboniferous Rainforest Collapse (CRC). Tropical rainforests fragmented and then were eventually devastated by climate change. Epoch: Permian Mean CO2 Concentration: 900 parts per million Mean Surface Temperature: 16 °C How long ago?: 280 to 250 million years ago Climate: The climate in the Permian was quite varied. At the start of the Permian, the Earth was still at the grip of an Ice Age from the Carboniferous. Glaciers receded around the mid-Permian period as the climate gradually warmed, drying the continent's interiors. In the late Permian period, the drying continued although the temperature cycled between warm and cool cycles. Epoch: Triassic Mean CO2 Concentration: 1750 parts per million (4.5 times that of today) Mean Surface Temperature: 17 °C How long ago?: 250 to 200 million years ago Climate: The Triassic climate was generally hot and dry, forming typical red bed sandstones and evaporites. There is no evidence of glaciation at or near either pole; in fact, the polar regions were apparently moist and temperate, a climate suitable for reptile-like creatures. Pangaea's large size limited the moderating effect of the global ocean; its continental climate was highly seasonal, with very hot summers and cold winters. It probably had strong, cross-equatorial monsoons. Epoch: Jurassic Mean CO2 Concentration: 1950 parts per million (5 times that of today) Mean Surface Temperature: 16.5°C (lower than Triassic period) How long ago?: 200 to 145 million years ago Climate: Early & Middle: “The Pangean Mega-monsoon was in full swing during the Early and Middle Jurassic. The interior of Pangea was very arid and hot. Deserts covered what is now the Amazon and Congo rainforests. China, surrounded by moisture bearing winds was lush and verdant. Late: “During the Late Jurassic the global climate began to change due to breakup of Pangea. The interior of Pangea became less dry, and seasonal snow and ice frosted the polar regions.” Epoch: Cretaceous Mean CO2 Concentration: 1700 parts per million (4.5 times that of today) Mean Surface Temperature: 18°C (higher than Jurassic period even if CO2 conc. was 250 ppm lower) How long ago?: 145 to 65 million years ago Climate: The Berriasian epoch showed a cooling trend that had been seen in the last epoch of the Jurassic. There is evidence that snowfalls were common in the higher latitudes and the tropics became wetter than during the Triassic and Jurassic. Glaciation was however restricted to alpine glaciers on some high-latitude mountains, though seasonal snow may have existed farther south. Rafting by ice of stones into marine environments occurred during much of the Cretaceous but evidence of deposition directly from glaciers is limited to the Early Cretaceous of the Eromanga Basin in southern Australia. After the end of the Berriasian, however, temperatures increased again, and these conditions were almost constant until the end of the period. This trend was due to intense volcanic activity which produced large quantities of carbon dioxide. The production of large quantities of magma, variously attributed to mantle plumes or to extensional tectonics, further pushed sea levels up, so that large areas of the continental crust were covered with shallow seas. The Tethys Sea connecting the tropical oceans east to west also helped in warming the global climate. Warm-adapted plant fossils are known from localities as far north as Alaska and Greenland, while dinosaur fossils have been found within 15 degrees of the Cretaceous south pole. A very gentle temperature gradient from the equator to the poles meant weaker global winds, contributing to less upwelling and more stagnant oceans than today. This is evidenced by widespread black shale deposition and frequent anoxic events. Sediment cores show that tropical sea surface temperatures may have briefly been as warm as 42 °C (107 °F), 17 °C (31 °F) warmer than at present, and that they averaged around 37 °C (99 °F). Meanwhile deep ocean temperatures were as much as 15 to 20 °C (27 to 36 °F) higher than today's. Epoch: Paleocene Mean CO2 Concentration: Not readily available Mean Surface Temperature: Not readily avai-lable How long ago?: 65 to 56 million years ago Climate: The early Paleocene was cooler and dryer than the preceding Cretaceous, though temperatures rose sharply during the Paleocene–Eocene Thermal Maximum. The climate became warm and humid worldwide towards the Eocene boundary, with subtropical vegetation growing in Greenland and Patagonia, crocodiles swimming off the coast of Greenland, and early primates evolving in tropical palm forests of northern Wyoming. The Earth's poles were cool and temperate; North America, Europe, Australia and southern South America were warm and temperate; equatorial areas had tropical climates; and north and south of the equatorial areas, climates were hot and arid. Epoch: Eocene Mean CO2 Concentration: Not readily available Mean Surface Temperature: Not readily available How long ago?: 56 to 34 million years ago Climate: One of the unique features of the Eocene’s climate as mentioned before was the equable and homogeneous climate that existed in the early parts of the Eocene. The Eocene Epoch contained a wide variety of different climate conditions that includes the warmest climate in the Cenozoic Era and ends in an icehouse climate. The evolution of the Eocene climate began with warming after the end of the Palaeocene-Eocene Thermal Maximum (PETM) at 56 million years ago to a maximum during the Eocene Optimum at around 49 million years ago. During this period of time, little to no ice was present on Earth with a smaller difference in temperature from the equator to the poles. Following the maximum, was a descent into an icehouse climate from the Eocene Optimum to the Eocene-Oligocene transition at 34 million years ago. During this decrease ice began to reappear at the poles, and the Eocene-Oligocene transition is the period of time where the Antarctic ice sheet began to rapidly expand. A multitude of proxies support the presence of a warmer equable climate being present during this period of time. A few of these proxies include the presence of fossils native to warm climates, such as crocodiles, located in the higher latitudes, the presence in the high-latitudes of frost-intolerant flora such as palm trees which cannot survive during sustained freezes, and fossils of snakes found in the tropics that would require much higher average temperatures to sustain them. Using isotope proxies to determine ocean temperatures indicate sea surface temperatures in the tropics as high as 35 °C (95 °F) and bottom water temperatures that are 10 °C (18 °F) higher than present day values. With these bottom water temperatures, temperatures in areas where deep-water forms near the poles are unable to be much cooler than the bottom water temperatures. An issue arises, however, when trying to model the Eocene and reproduce the results that are found with the proxy data. Using all different ranges of greenhouse gases that occurred during the early Eocene, models were unable to produce the warming that was found at the poles and the reduced seasonality that occurs with winters at the poles being substantially warmer. The models, while accurately predicting the tropics, tend to produce significantly cooler temperatures of up to 20 °C (36 °F) underneath the actual determined temperature at the poles. This error has been classified as the “equable climate problem”. To solve this problem, the solution would involve finding a process to warm the poles without warming the tropics. Epoch: Oligocene Mean CO2 Concentration: Not readily available Mean Surface Temperature: Not readily available How long ago?: 34 to 23 million years ago Climate: The Paleogene Period general temperature decline is interrupted by an Oligocene 7 million year stepwise climate change. A deeper 8.2 °C, 400,000 year temperature depression leads the 2 °C, 7 million year stepwise climate change 33.5 Ma (Million years ago). The stepwise climate change began 25.5Ma and lasted through 32.5 Ma, as depicted in the PaleoTemps chart. The Oligocene climate change was a global increase in ice volume and a 55 M (181 feet) decrease in sea level (35.7-33.5 Ma) with a closely related (25.5-32.5 Ma) temperature depression. The 7 million year depression abruptly terminated within 1-2 million years of the La Garita Caldera eruption at 28-26 Ma. A deep 400,000 year glaciated Oligocene Miocene boundary event is recorded at McMurdo Sound and King George Island. Epoch: Miocene Mean CO2 Concentration: Not readily available Mean Surface Temperature: Not readily available How long ago?: 23 to 5 million years ago Climate: The earth went from the Oligocene Epoch through the Miocene and into the Pliocene as it cooled into a series of Ice Ages. The Miocene boundaries are not marked by a single distinct global event but consist rather of regional boundaries between the warmer Oligocene and the cooler Pliocene. Epoch: Today (May 2019) Mean CO2 Concentration: 415 parts per million Mean Surface Temperature: 14 °C Sources: - www.amazon.com/Global-Warming-Pseudoscience-James-Clancy/dp/1478373482 - dinopedia.fandom.com/wiki/Main_Page - pubs.geoscienceworld.org/gsabulletin - www.scotese.com - www.palaeos.com - 540 - 65 Myr BP : Royer, Dana L. and Robert A. Berner, Isabel P. Montañez, Neil J. Tabor, David J. Beerling (2004) CO2 as a primary driver of Phanerozoic climate GSA Today July 2004, volume 14, number 3, pages 4-10, dx.doi.org/10.1130%2F1052-5173%282004%29014%3C4%3ACAAPDO%3E2.0.CO%3B2 - 65 - 5.5 Myr BP : Zachos, James, Mark Pagani, Lisa Sloan, Ellen Thomas, and Katharina Billups (2001). "Trends, Rhythms, and Aberrations in Global Climate 65 Ma to Present". Science 292 (5517): 686–693. dx.doi.org/10.1126%2Fscience.1059412 - 5.5 Myr - 420 kyr BP : Lisiecki, L. E., and M. E. Raymo (2005), A Pliocene-Pleistocene stack of 57 globally distributed benthic δ18O records, Paleoceanography, 20, PA1003, dx.doi.org/10.1029%2F2004PA001071 - 420 kyr - 12 kyr BP : Petit J.R., Jouzel J., Raynaud D., Barkov N.I., Barnola J.M., Basile I., Bender M., Chappellaz J., Davis J., Delaygue G., Delmotte M., Kotlyakov V.M., Legrand M., Lipenkov V., Lorius C., Pépin L., Ritz C., Saltzman E., Stievenard M. (1999) Climate and Atmospheric History of the Past 420,000 years from the Vostok Ice Core, Antarctica, Nature, 399, pp.429-436, dx.doi.org/10.1038%2F20859 - Munnecke, A.; Calner, M.; Harper, D. A. T.; Servais, T. (2010). "Ordovician and Silurian sea-water chemistry, sea level, and climate: A synopsis". Palaeogeography, Palaeoclimatology, Palaeoecology 296 (3–4): 389–413, dx.doi.org/10.1016%2Fj.palaeo.2010.08.001 - Explosion in marine biodiversity explained by climate change: www.sciencedaily.com/releases/2008/07/080727225420.htm - Sahney, S., Benton, M.J. & Falcon-Lang, H.J. (2010). "Rainforest collapse triggered Pennsylvanian tetrapod diversification in Euramerica" (PDF). Geology 38 (12): 1079–1082, dx.doi.org/10.1130%2FG31182.1, geology.geoscienceworld.org/cgi/content/abstract/38/12/1079 - www.palaeos.com/Paleozoic/Permian/Permian.htm - Earth System History by Steven M. Stanley, 452-3, 480-2, 481-2, www.amazon.com/s?rh=p_66%3A0716728826&field-isbn=0716728826 - The Berriasian Age, palaeos.com/mesozoic/cretaceous/berriasian.html - Foulger, G.R. (2010). Plates vs. Plumes: A Geological Controversy. Wiley-Blackwell, ISBN 978-1-4051-6148-0, www.wiley.com/WileyCDA/WileyTitle/productCd-1405161485.html, en.wikipedia.org/wiki/Special:BookSources/978-1-4051-6148-0 - "Warmer than a Hot Tub: Atlantic Ocean Temperatures Much Higher in the Past", PhysOrg.com, www.physorg.com/news10978.html - Skinner, Brian J., and Stephen C. Porter. The Dynamic Earth: An Introduction to Physical Geology. 3rd ed. New York: John Wiley & Sons, Inc., 1995. ISBN 0-471-59549-7. p. 557, en.wikipedia.org/wiki/Special:BookSources/0471595497 - PaleoMap Project: Paleocene Climate, www.scotese.com/paleocen.htm - Sloan, L. C., and D. K. Rea, 1995: Atmospheric carbon dioxide and early Eocene climate: a general circulation modeling sensitivity study. Paleogeo. Paleoclim. Paleoeco. 119, 275-292 - Huber, M., 2009: Snakes tell a torrid tale. Nature, 457, 669-671 - Huber, M., and R. Caballero, 2011: The early Eocene equable climate problem revisited. Clim. Past Discuss. 6, 241-304 - Sloan, L. C., and E. J. Barron, 1990: “Equable” climates during Earth history? Geology, 18, 489-492 - A.Zanazzi (et al.) 2007 'Large Temperature Drop across the Eocene Oligocene in central North America' Nature, Vol. 445, 8 February 2007 - C.R.Riesselman (et al.) 2007 'High Resolution stable isotope and carbonate variability during the early Oligocene climate transition: Walvis Ridge (ODP Site 1263) USGS OF-2007-1047 - Lorraine E. Lisiecki Nov 2004; A Pliocene-Pleistocene stack of 57 globally distributed benthic δ18O records Brown University, PALEOCEANOGRAPHY, VOL. 20 - Kenneth G. Miller Jan-Feb 2006; Eocene–Oligocene global climate and sea-level changes St. Stephens Quarry, Alabama GSA Bulletin, Rutgers University, NJ - Robert A. Rohde (2005). "GeoWhen Database", www.stratigraphy.org/bak/geowhen/stages/Miocene.html - Susanne S. Renner (2011). "Living fossil younger than thought". Science 334 (6057): 766–767, dx.doi.org/10.1126%2Fscience.1214649, www.ncbi.nlm.nih.gov/pubmed/22076366 Real Science by Charnock & Shine, Kondratjew & Moskalenko and Lindzen show that even if CO2 jumps to 600 parts per million (ppm) in the atmosphere, the temperature rise would be between +0.64°C and +1.46°C. And the above is CO2 in isolation, without taking into account other factors which have a significant impact on the climate such as the Sun (solar activity/sunspots), volcanoes, Pacific Decadal Oscillation (PDO), cloud albedo, cosmic rays, Sun's and Earth's magnetic fields, etc. Note also the following facts (these are covered in more detail in separate fact checks):
  New NOAA measuring system complies with federal standards By WND Staff Published August 29, 2019 "The difficulty of accurately measuring average temperatures around the globe and across the United States has helped fuel the conflicting claims regarding climate change. Purveyors of the belief that mankind is catastrophically impacting the global climate insist it's getting warmer year by year. But a new, improved system to assess surface temperatures established in 2005 by the National Oceanic and Atmospheric Administration, NOAA, indicates otherwise. In fact, the U.S. Climate Reference Network -- comprised of 114 pristinely maintained temperature stations spaced relatively uniformly across the lower 48 states -- finds there has been no warming for the past 14 years at least, noted the Powerline blog. While historically the U.S. has been considered to have the best records, surveys show that over half of the nation's weather stations do not comply with written standards, pointed out Powerline contributor John Hinderaker. Some are next to airport runways and many are in cities, where temperatures are artificially inflated. "And on top of all of that, the alarmists who curate weather records have systematically fiddled with them, lowering temperatures that were recorded decades ago and raising recent ones, to exaggerate the supposed phenomenon of global warming," he wrote. Climate-change skeptics have pointed to examples such as Penn State Professor Michael Mann's iconic "hockey stick" graph purporting to show a spike in average global temperatures in the 20th century. Mann lost a defamation suit last week [August 2019] after failing to present evidence to back his claim. Critics argue his graph doesn't take into account periods such as the Little Ice Age and the Medieval Warming Period. NOAA's system utilizes locations far away from urban and land-development impacts, eliminating the need to adjust the data." 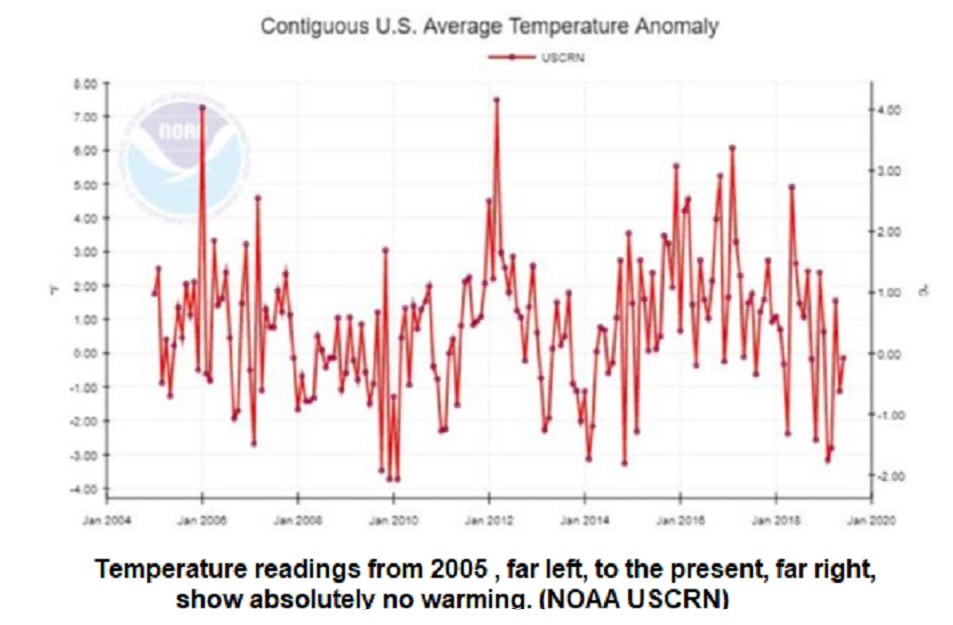 No warming since 1930s?
"James Taylor, director of the Arthur B. Robinson Center for Climate and Environmental Policy at the Heartland Institute, writes at Real Clear Energy that there's "also good reason to believe U.S. temperatures have not warmed at all since the 1930s." "Raw temperature readings at the preexisting stations indicate temperatures are the same now as 80 years ago," he writes. "All of the asserted U.S. warming since 1930 is the product of the controversial adjustments made to the raw data. Skeptics point out that as the American population has grown, so has the artificial warming signal generated by growing cities, more asphalt, more automobiles, and more machinery." Taylor contends that, if anything, the raw temperature readings "should be adjusted downward today relative to past temperatures (or past temperatures adjusted upward in comparison to present temperatures) rather than the other way around." "If raw temperature readings are the same today as they were 80 years ago, when there were fewer artificial factors spuriously raising temperature readings, then U.S. temperatures today may actually be cooler than they were in the early 20th century," he reasons." Source: www.wnd.com/2019/08/official-no-u-s-warming-since-least-2005 World Wide Sea Level information and evolution since 1900 can be found here:
NOAA's 2016 list of 375 long term trend tide stations: And in 2001, James Hansen reconfirmed his dire prediction to Mr. Reiss! "Extreme weather means more terrifying hurricanes and tornadoes and fires than we usually see. But what can we expect such conditions to do to our daily life? While doing research 12 or 13 years ago, I met Jim Hansen, the scientist who in 1988 predicted the greenhouse effect before Congress. I went over to the window with him and looked out on Broadway in New York City and said, “If what you’re saying about the greenhouse effect is true, is anything going to look different down there in 20 years?” He looked for a while and was quiet and didn’t say anything for a couple seconds. Then he said, “Well, there will be more traffic.” I, of course, didn’t think he heard the question right. Then he explained, “The West Side Highway [which runs along the Hudson River] will be under water. And there will be tape across the windows across the street because of high winds. And the same birds won’t be there. The trees in the median strip will change.” Then he said, “There will be more police cars.” Why? “Well, you know what happens to crime when the heat goes up.” And so far, over the last 10 years, we’ve had 10 of the hottest years on record. Didn’t he also say that restaurants would have signs in their windows that read, “Water by request only.” Under the greenhouse effect, extreme weather increases. Depending on where you are in terms of the hydrological cycle, you get more of whatever you’re prone to get. New York can get droughts, the droughts can get more severe and you’ll have signs in restaurants saying “Water by request only.” When did he say this will happen? Within 20 or 30 years. And remember we had this conversation in 1988 or 1989. Does he still believe these things? Yes, he still believes everything. I talked to him a few months ago and he said he wouldn’t change anything that he said then." UPDATE IN 2011: After a furor over the original prediction, the Salon interviewee and book author, Rob Reiss "admitted" that he somehow conflated 40 years with 20 years, and "conceded" that Dr. Hansen actually said 40 years for his prediction. However, as the analysis in 2011 showed, it did not make any difference, and we still were not seeing the magnitude of sea level rise predicted, 23 years into it. "According to the actual data, after 23 years, we’ve seen about a 2.5 INCH rise. There’s still a very long way to go to 10 FEET to cover the West Side Highway there." 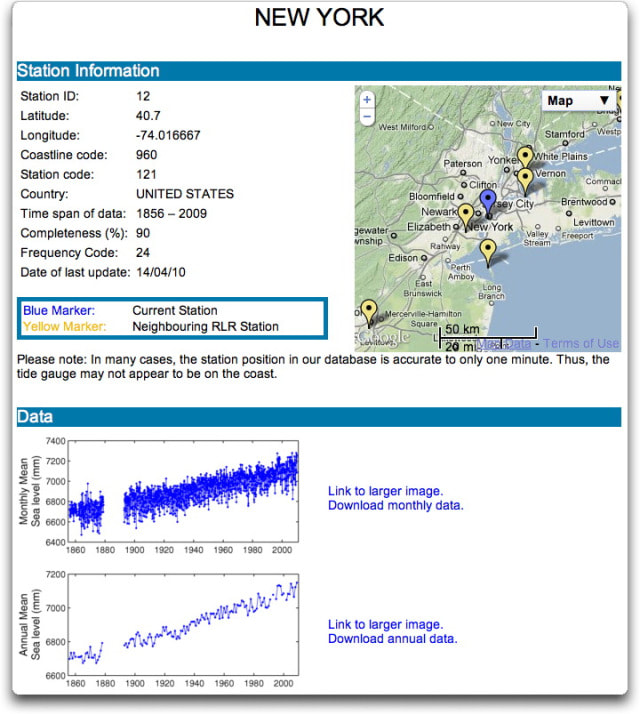 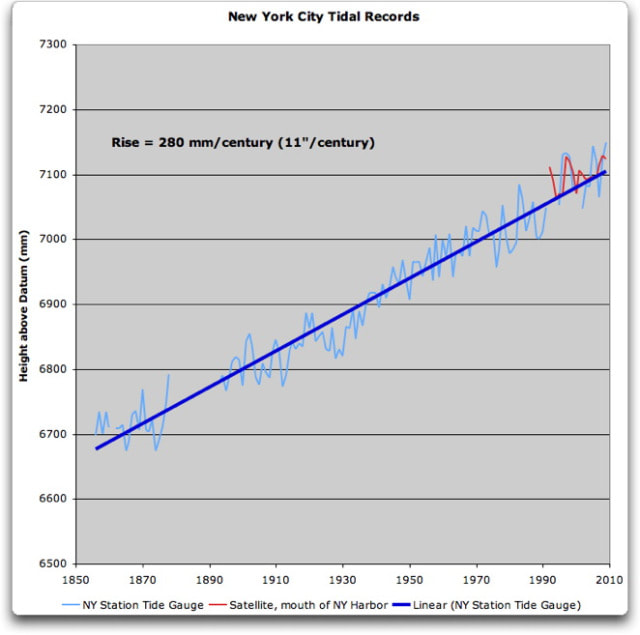 "Here’s a ground level view (via a tourist photo) so you can see the vertical distance from the roadway to the sea level on that day and tide condition. Sure looks like at least 10 feet to me. The Salon interviewee and book author, Rob Reiss admits he somehow conflated 40 years with 20 years, and concedes that Dr. Hansen actually said 40 years for his prediction (back in 1988). In 2012, 24 years later, we are not seeing anywhere the magnitude of sea level rise forecast by Hansen’s pseudoscience. Actually 20 or 40 years does not make a difference. Per Dr. Hansen’s prediction in 1988, even if we assume a 40 year time span, the sea level rise should have been about halfway up the side of Manhattan Island by now."  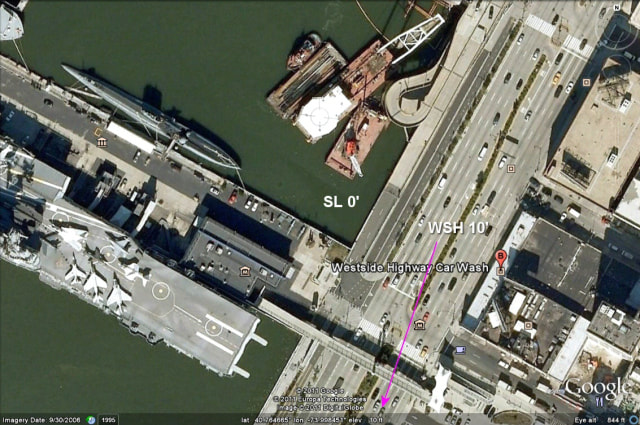 Posted Feb 3, 2017 by Martin Armstrong A shocking statement was made by a United Nations official Christiana Figueres at a news conference in Brussels. Figueres admitted that the Global Warming conspiracy set by the U.N.’s Framework Convention on Climate Change, of which she is the executive secretary, has a goal not of environmental activists to save the world from ecological calamity, but to destroy capitalism. She said very casually:
She even restated that goal ensuring it was not a mistake: “This is probably the most difficult task we have ever given ourselves, which is to intentionally transform the economic development model for the first time in human history.” I was invited to a major political dinner in Washington with the former Chairman of Temple University since I advised the University with respect to its portfolio. We were seated at one of those round tables with ten people. Because we were invited from a university, they placed us with the heads of the various environmental groups. They assumed they were in friendly company and began speaking freely. Dick Fox, my friend and Chairman of Temple, began to lead them on to get the truth behind their movement. Low and behold, they too admitted it was not about the environment, but to reduce population growth. Dick then asked them, “Whose grandchild are we trying to prevent from being born? Your’s or mine?” All of these movements seem to have a hidden agenda that the press helps to misrepresent all the time. One must wonder, at what point will the press realize they are destroying their own future? 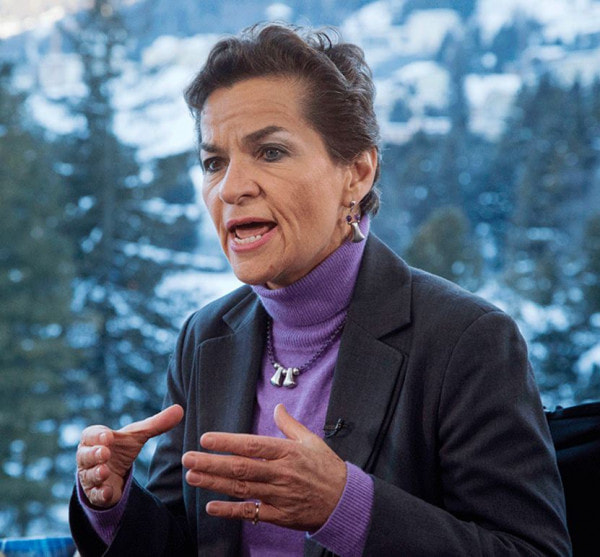 |