
|
You may have seen the below graph on Wikipedia. The graph is INACCURATE. Even if the graph shows China's CO2 emissions drastically increasing in the 1990s and 2000s, it portrays China's CO2 emissions as flatlining in the 2010s. This is FALSE! 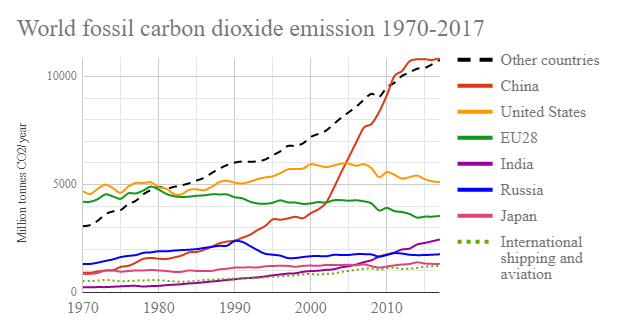 In 2017, China's CO2 emissions INCREASED by 120 MILLION TONS compared to 2016 CO2 emissions! Under the Paris Agreement, China can increase CO2 emissions as much as it wants until a promised peak in 2030. In 2017, India's CO2 emissions INCREASED by OVER 90 MILLION TONS compared to 2016 CO2 emissions! Under the Paris Agreement, India will keep INCREASING CO2 emissions but at a RATE OF INCREASE REDUCED BY 33-35% (compared to 2005 levels) and even that commitment is only a promise to be met by 2030 (not today). 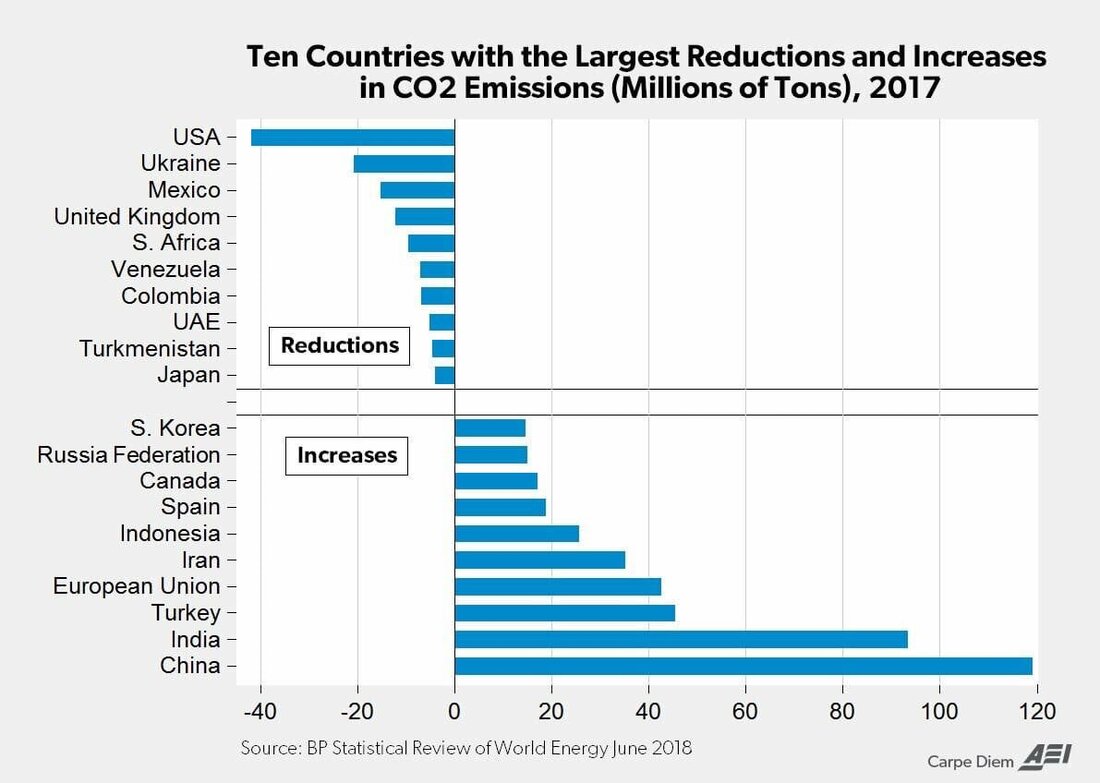 Leftist propagandists, with the help of their fake "fact" checkers, may be quick to dismiss the above graph because it was published by British Petroleum (BP). But the above data has been CONFIRMED by the Global Carbon Project! Global Carbon Project reported even higher 2017 China CO2 emissions increase than BP! 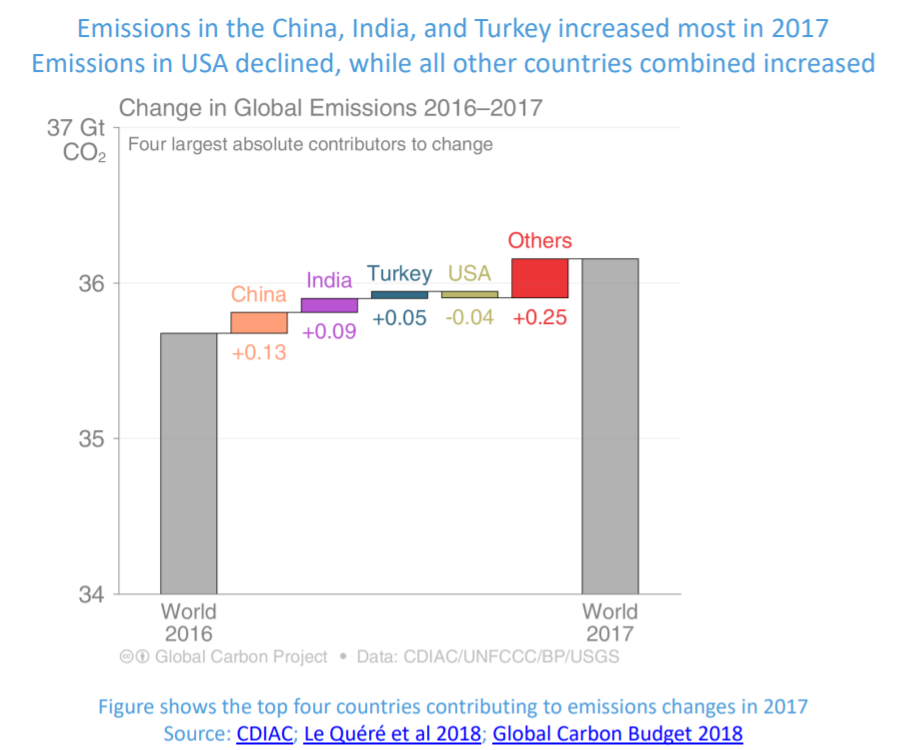 What more proof does one need to be convinced that man-made "climate change" hysteria has nothing to do with the climate and everything to do with globalist wealth redistribution? Below are additional graphs showing the evolution of CO2 emissions by country. 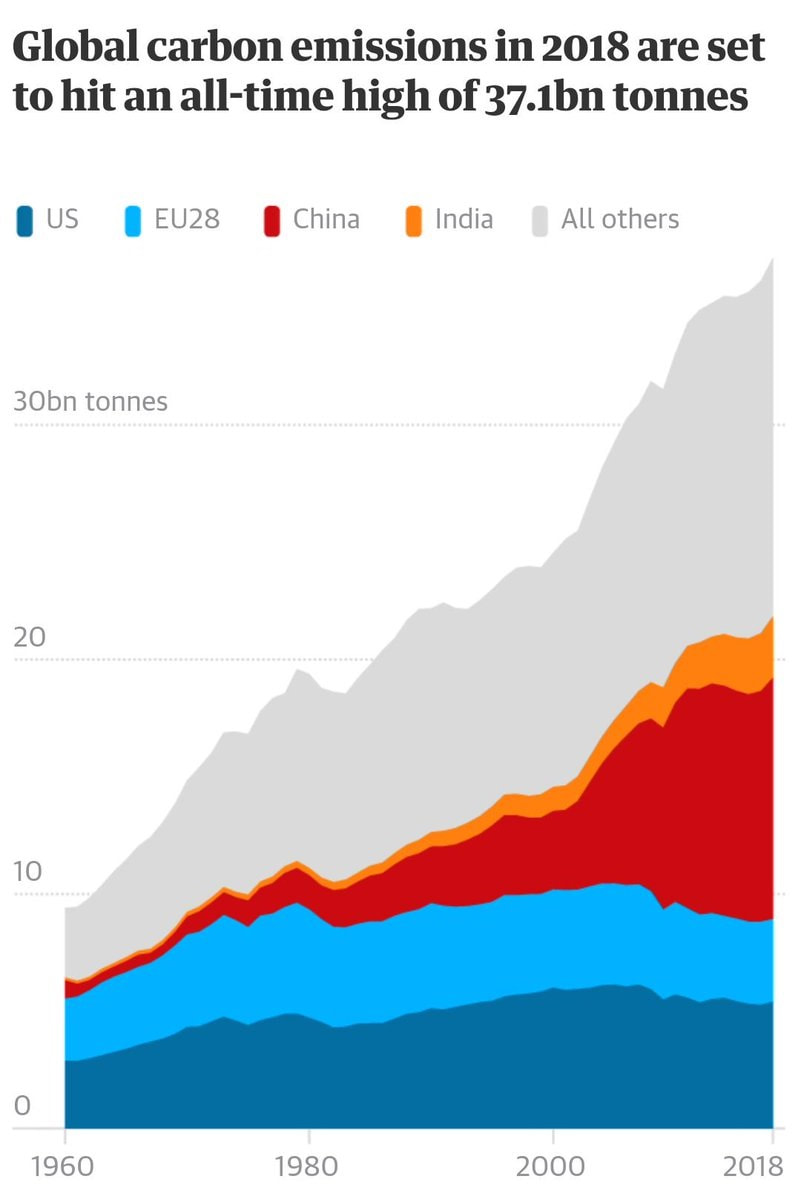 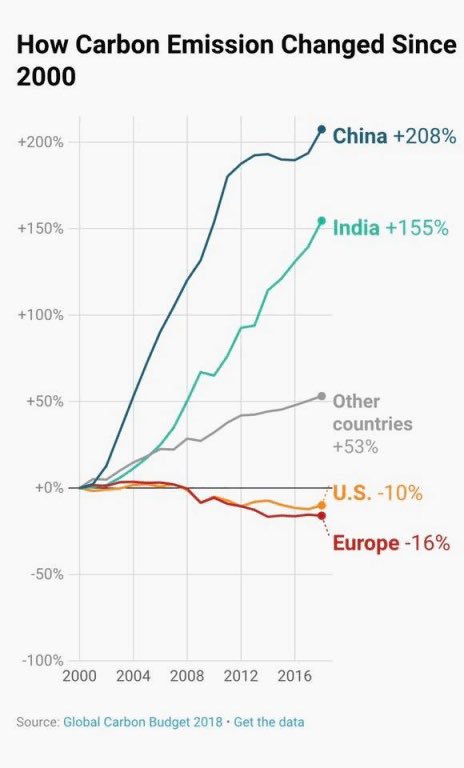 Sources:
0 Comments
Leave a Reply. |
